
For any aspiring trader, understanding charts is like deciphering a secret language. Price movements, trends, and potential entry/exit points all lie hidden within the bars and lines. While veteran traders may seem to have an innate ability to navigate these charts, it’s all about knowledge and practice. This blog dives deep into the world of charts, equipping you with the essential tricks to unlock their secrets and make informed trading decisions.
Chart Types
Most are familiar with the ubiquitous candlestick charts, but there’s a whole world to explore.
- Line Charts: Simple and effective, line charts track closing prices over time, offering a clear view of long-term trends.
- Renko Charts: These focus on price movements rather than time, revealing underlying trends by depicting price changes in “bricks.”
- Heikin-Ashi Candlesticks: Offering a smoother visual representation, these candlesticks use the previous day’s data to calculate opening and closing prices, potentially highlighting trend reversals.
Understanding the Actors: Price, Volume, and Indicators
A chart isn’t just a visual representation of price; it’s a dynamic interplay of forces.
- Price: The star of the show! Identify prior highs and lows (support and resistance levels) to understand potential price movements.
- Volume: High volume often accompanies strong trends, while low volume can indicate periods of consolidation or indecision.
- Indicators: These are mathematical tools layered onto the chart to help analyze price trends and predict future movements. Popular options include Relative Strength Index (RSI) and Moving Average Convergence Divergence (MACD).
Pro Tip: Don’t rely solely on indicators! Combine them with price action and volume for a more holistic understanding.
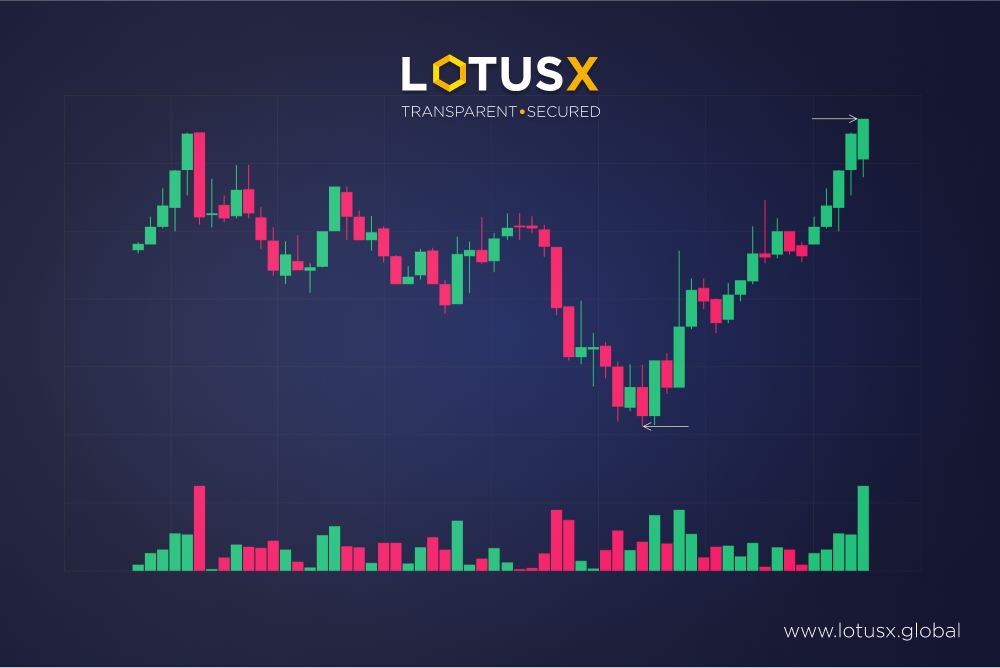
Chart Patterns
Certain price patterns emerge repeatedly, offering valuable insights into potential future movements.
- Head and Shoulders: This reversal pattern indicates a potential trend shift, with a middle peak (head) flanked by two lower peaks (shoulders).
- Double Bottom/Top: These patterns suggest a potential trend reversal, with the price bouncing off a support/resistance level twice before breaking through.
- Flags and Pennants: These consolidation patterns signal a continuation of the prevailing trend after a period of price fluctuation.
Remember: Chart patterns are probabilities, not guarantees. Always consider other factors like market sentiment and news events.
The Secret No One Tells You: Patience is Key
Crypto Charts are powerful tools, but they won’t predict the future with absolute certainty. The key to successful trading is patience. Don’t chase every trade; wait for the right confluence of chart signals, volume, and market conditions before making a move.
Before risking real capital, utilize paper trading accounts to test your chart reading skills and trading strategies in a simulated environment.
The Final Word
The world of charts is vast and ever-evolving. Stay curious, back-test your strategies, and learn from your experiences. By consistently honing your chart reading skills, you’ll unlock a deeper understanding of the market and navigate your trading journey with greater confidence.